Jenkins Remoting Monitoring
Goal: Support monitoring and troubleshooting of Jenkins remoting system with OpenTelemetry.
Status: Completed
Team
-
Student:
Akihiro Kiuchi

-
Mentor(s):
Oleg Nenashev , Darshan Kansagara ,
 Sumit Sarin , Cyrille Le Clerc
Details
Purpose
In Jenkins, we have a Remoting module, which implements a communication layer in the Jenkins automation server. It’s being primarily used for controller ⇔ agent interaction. The purpose of this project is to develop a software to support the monitoring and troubleshooting of Remoting systems.
This can benefit to system admins who often manage Jenkins on a daily basis. Such integration with monitoring tools will help system admins to faster address the issues, bottlenecks when working with Jenkins. Therefore, this plugin will help to provide a better monitoring experience for system admins in using Jenkins as their daily automation pipeline.
Goal
The goal of this project:
-
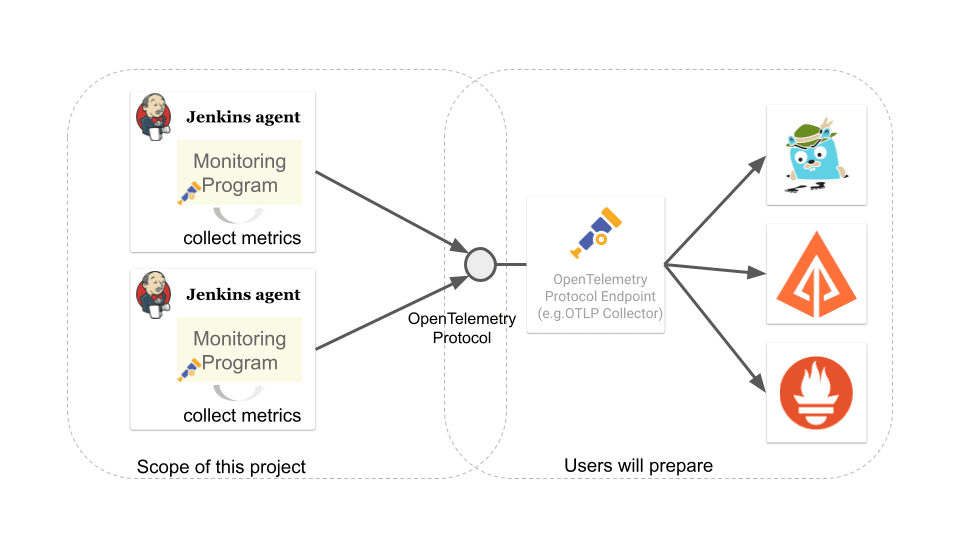
collect telemetry data(metrics, traces, logs) of Remoting module with OpenTelemetry.
-
send the telemetry data to OpenTelemetry Protocol endpoint.
Which OpenTelemetry endpoint to use and how to visualize the data are up to users.
Phase 1 summary.
- User survey
-
Our team conducted a user survey to understand the pain point regarding the Jenkins Remoting. Please see the User survey section in the phase 1 blog post for details.
- Proof of Concept
-
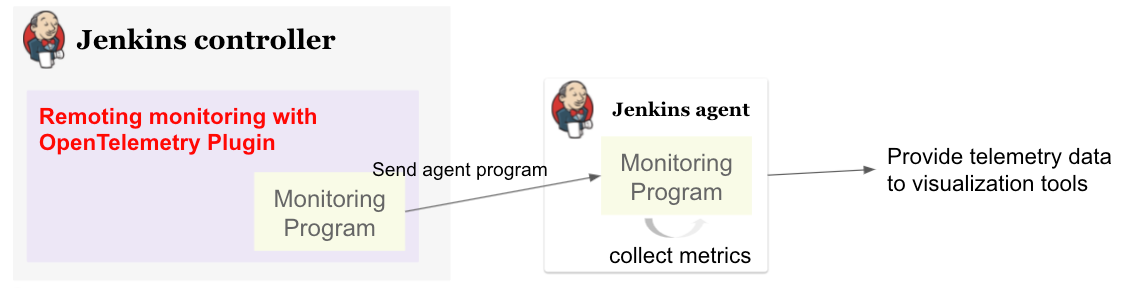
- How to deliver the monitoring program to the agents
-
We tried two approaches
-
Send the monitoring program to the agent over Remoting
-
Install the monitoring engine when provisioning a new agent
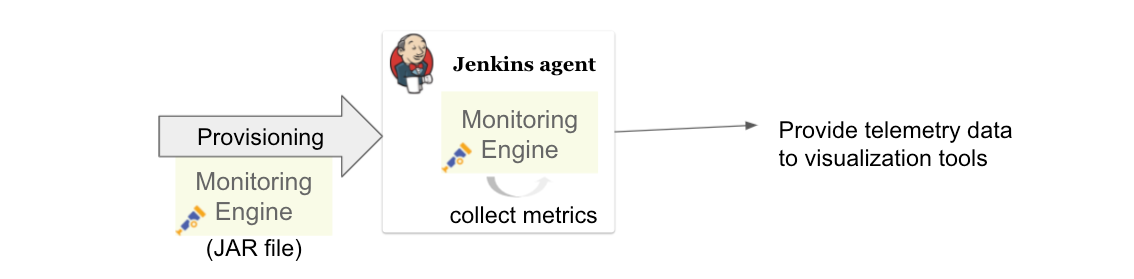
Then, I decided to take the second approach. Please see the relevant section in the phase 1 blog post for details.
-
- How to instrument remoting for tracing
-
Approach 1 Use EngineListener : Pull Request
↑ This PR was merged once but removed later.Approach 2 Add instrumentation extension points to Remoting module : Pull Request
We tried two approaches above, but I couldn’t find out a good approach to instrument Remoting. Please see the Future work section and GitHub issue for details.
- Metrics
-
We implemented a feature to collect general metrics (e.g., System CPU load, JVM memory usage) and export them to an OTLP endpoint. The list of metric types collected in the phase1 is listed here.
Phase 2 summary.
- Log feature
-
Export agent logs to an OTLP/gRPC endpoint: PR #67
- Release as Jenkins plugin
-
We released this project as Jenkins plugin🎉
- Regex metrics filter
-
Filter metrics to collect by the regular expression. PR #80
- Additional metrics
-
-
Filesystem metrics: PR #82
-
- Configuration
- Demo Examples
-
We prepared two demo examples so that users can quickly try out the features.
- Docker Compose Demo
-
We prepared Docker Compose example, which sets up
-
Jenkins controller
-
preconfigured with JCasC
-
-
Jenkins inbound agents
-
instrumented with our monitoring engine
-
-
OpenTelemetry Collector
-
Loki for Log aggregation
-
Prometheus for metric backend
-
Grafana for log and metric visualization
-
datasource is preconfigured
-
Please see the relevant section in README for details.
-
- Kubernetes Demo
-
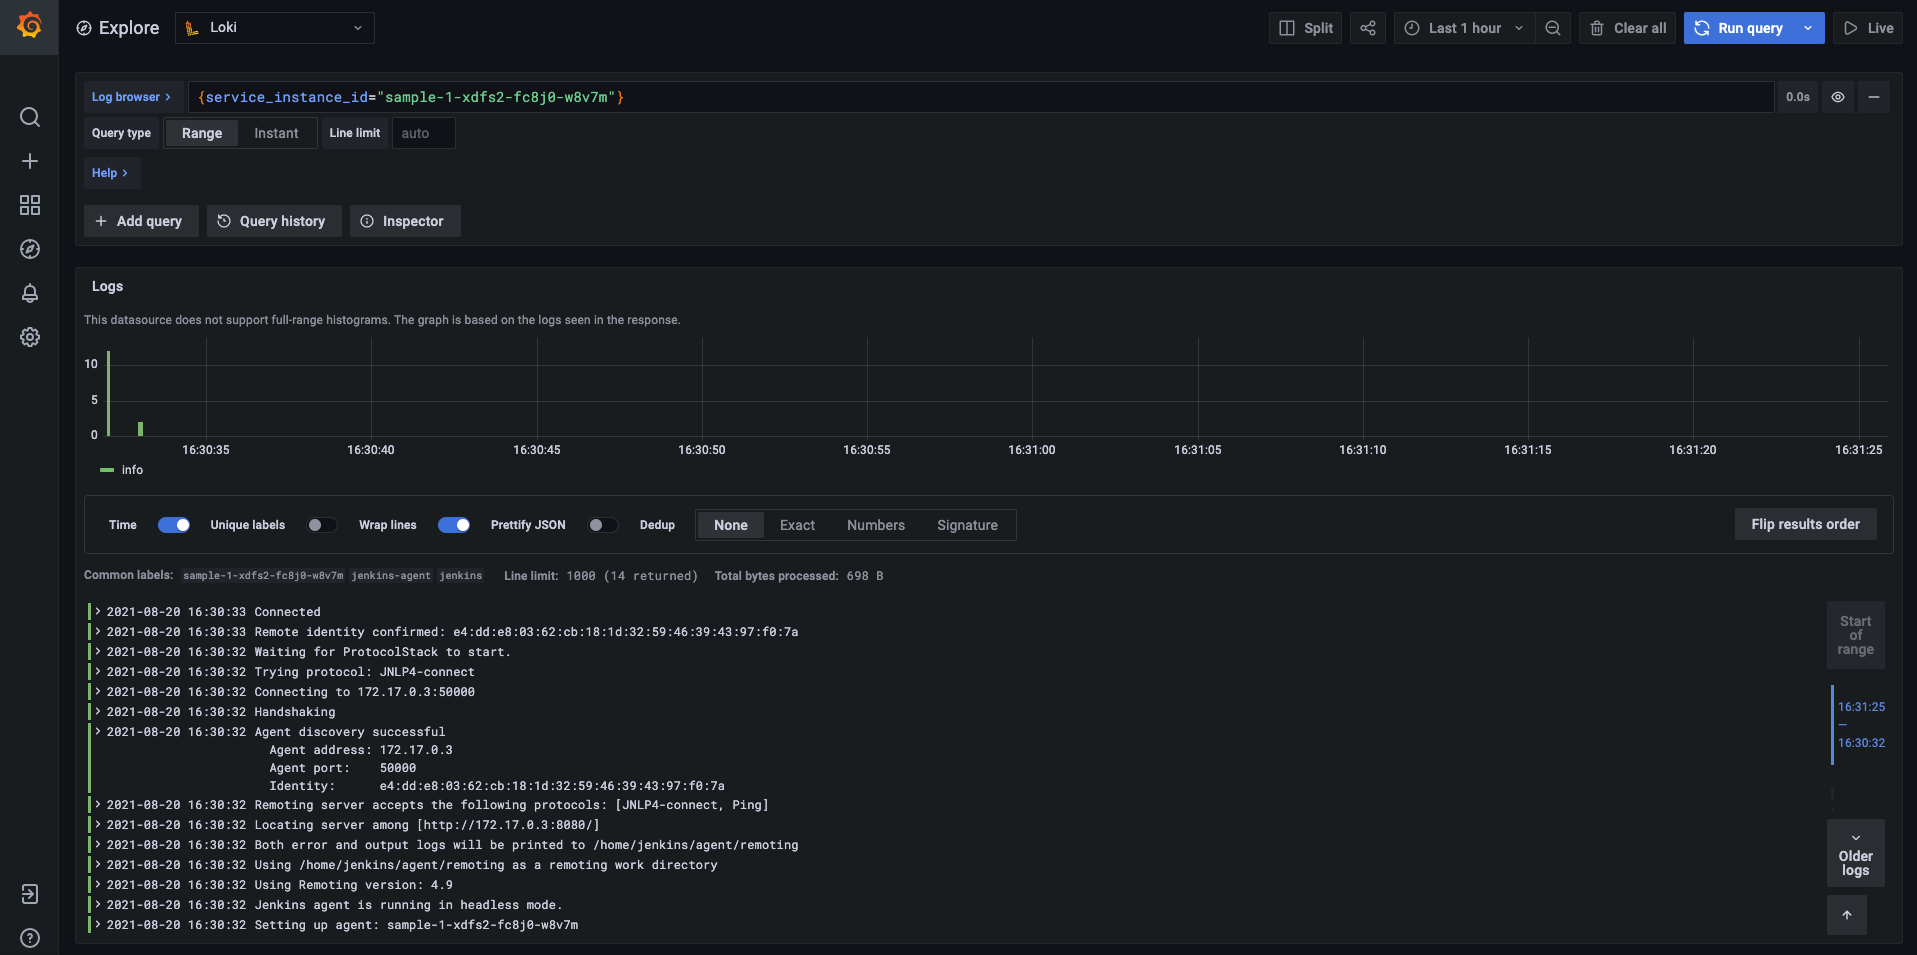
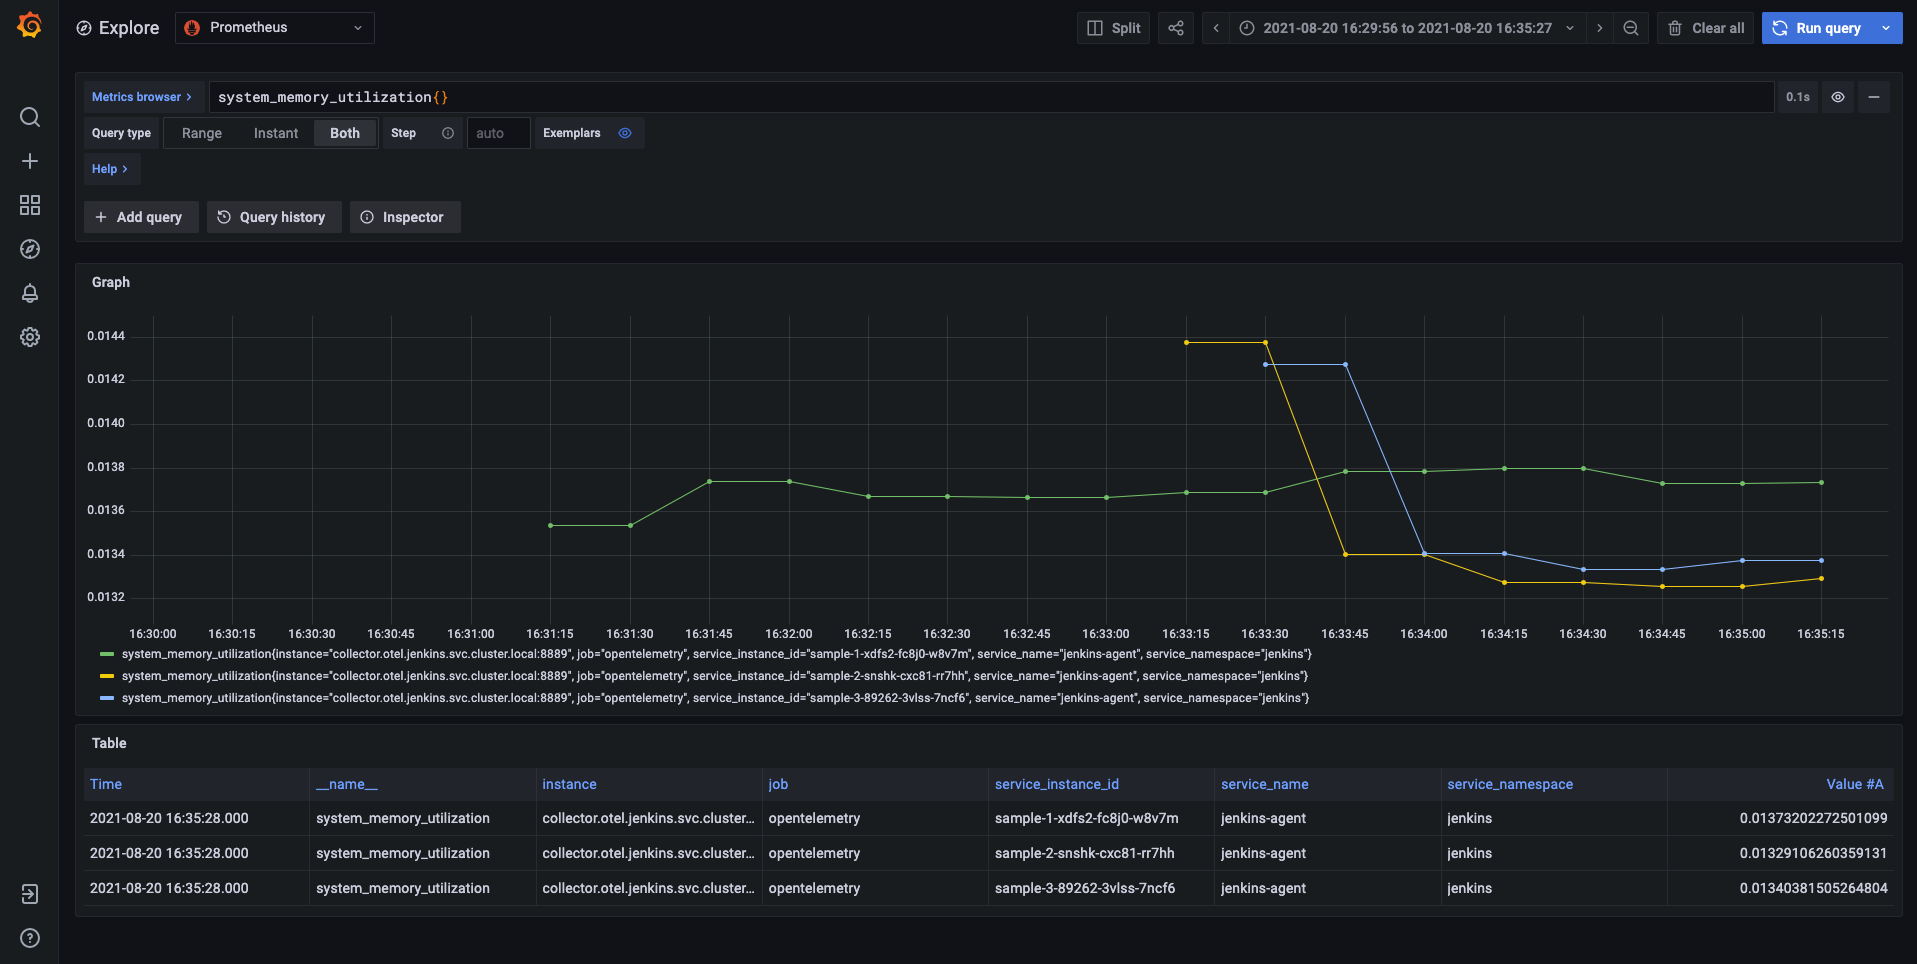
We also prepared a demo with Kubernetes. It sets up all the component mentioned in the Docker Compose Demo section on a Kubernetes cluster, and launches agents using Kubernetes plugin. Service instance id, by which OpenTelemetry identifies the data producing instance, will be automatically set to Jenkins agent name.
Please see Demo repository for details.
- Demo snapshot
-
Click to open in new tab
Future work
During this GSoC period, I couldn’t find out a good way to instrument Remoting module for tracing. Also, I couldn’t identify the valuable tracing in Remoting, which really helps admins to monitoring and troubleshooting the Remoting system.
I summarized what I tried and what I thought during this GSoC in the issue. This is the feature work of this project.
Chat
We use the #gsoc-jenkins-remoting-monitoring channel in the CDF Slack workspace.
How to join.
References
-
Plugin page: https://plugins.jenkins.io/remoting-opentelemetry/
-
Kubernetes Demo repository: https://github.com/Aki-7/remoting-opentelemetry-kubernetes-demo/
-
Remoting library: https://github.com/jenkinsci/remoting
-
Remoting sub-project: project page
-
OpenTelemetry https://opentelemetry.io/
-
Prometheus: https://prometheus.io/
-
Grafana: https://grafana.com/