Remoting Monitoring with OpenTelemetry - Coding Phase 1

Goal
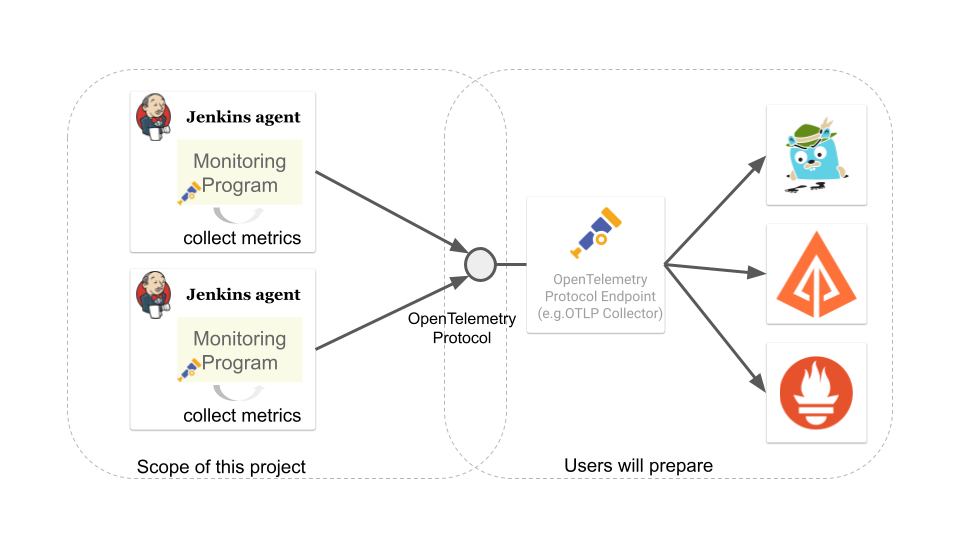
The goal of this project:
-
collect telemetry data(metrics, traces, logs) of remoting module with OpenTelemetry.
-
send the telemetry data to OpenTelemetry Protocol endpoint
Which OpenTelemetry endpoint to use and how to visualize the data are up to users.
OpenTelemetry

An observability framework for cloud-native software
OpenTelemetry is a collection of tools, APIs, and SDKs. You can use it to instrument, generate, collect, and export telemetry data(metrics, logs, and traces) for analysis in order to understand your software’s performance and behavior.
Phase 1 summary
User survey
Our team conducted a user survey to understand the pain point regarding Jenkins remoting.
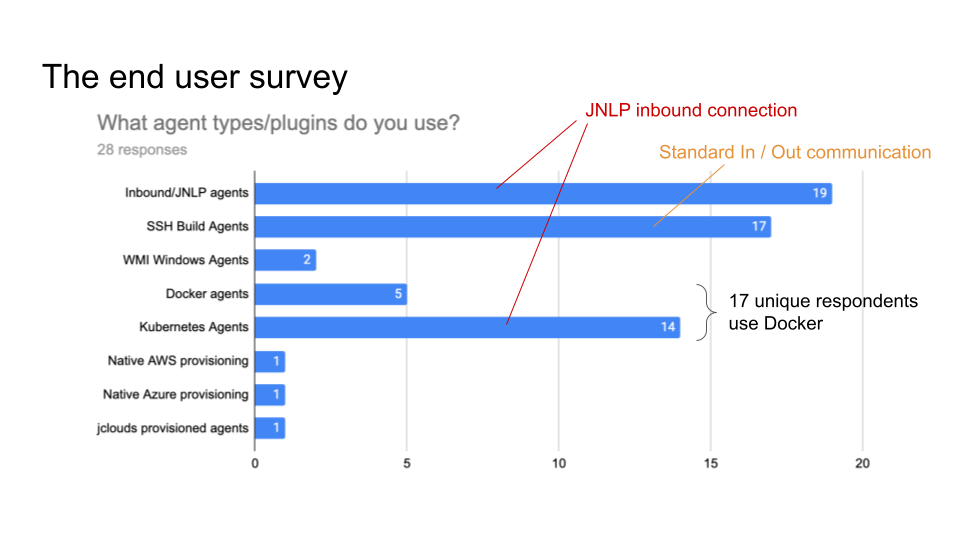
Fig 1 shows what types of agent users use, and 17 unique respondents out of 28 use docker for agent. So I’m planning to publish a docker image to demonstrate how we can build Docker image with our monitoring feature.
This survey and investigation of JIRA tickets of past two years also tell me five common causes of agent unavailability.
-
Configuration mistakes
-
Jenkins agent settings, e.g. misuse of "tunnel connection through" option.
-
Platform settings, e.g. invalid port setting of Kubernetes' helm template.
-
Network settings, e.g. Load balancer misconfiguration.
-
-
Uncontrolled shutdown of nodes for downscaling.
-
Timeout during provisioning a new node.
-
Firewall, antivirus software or other network component kill the connection
-
Lack of hardware resources, e.g. memory, temp space, etc…
We also heard valuable user voice in the survey.
I have created a bunch of adhoc monitoring jobs to check on the agent’s health and send e-mail. Would be nice to have this consolidated.
Having archive of nodes with the access to their logs/events would have been nice.
I hope that implementing these feature with OpenTelemetry, which is expected to become the industry standard for observability, will bring great monitoring experience to Jenkins community.
Proof of Concept
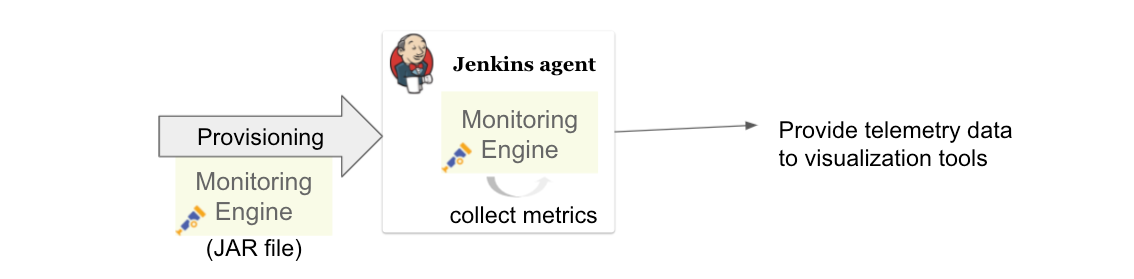
How to deliver the monitoring program to agents
1. Sending monitoring program to the agent over remoting
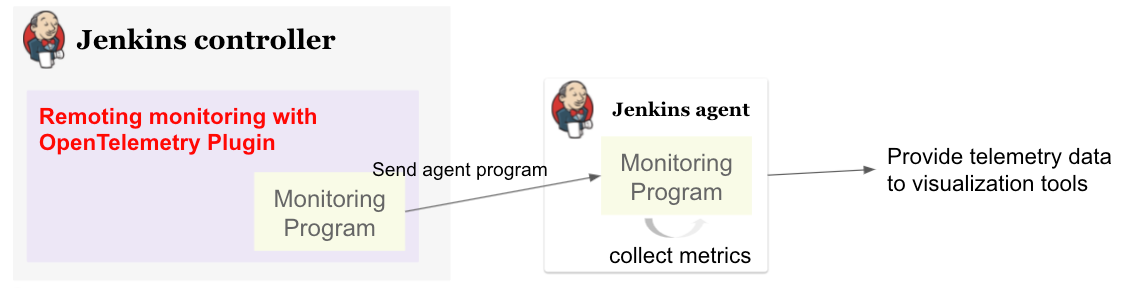
In my first implementation, I prepared a Jenkins plugin and send the monitoring program from Jenkins controller. However, this approach have following disadvantages.
-
We cannot collect telemetry data before the initial connection. We are likely to encounter a problem while provisioning a new node, so it’s important to observe agents' telemetry data from the beginning.
-
Some agent restarters (e.g. UnixSlaveRestarter) restart agent completely when reconnecting. It means that the agent lost monitoring program every time the connection closed, and we cannot collect telemetry data after the connection is lost before a new connection is established.
So we decided to take the next approach.
How to instrument remoting to produce remoting trace
Add instrumentation extension point to remoting
Pull Request: https://github.com/jenkinsci/remoting/pull/471
This approach makes the agent launch command more complicated, and we have to overcome this problem.
Current State
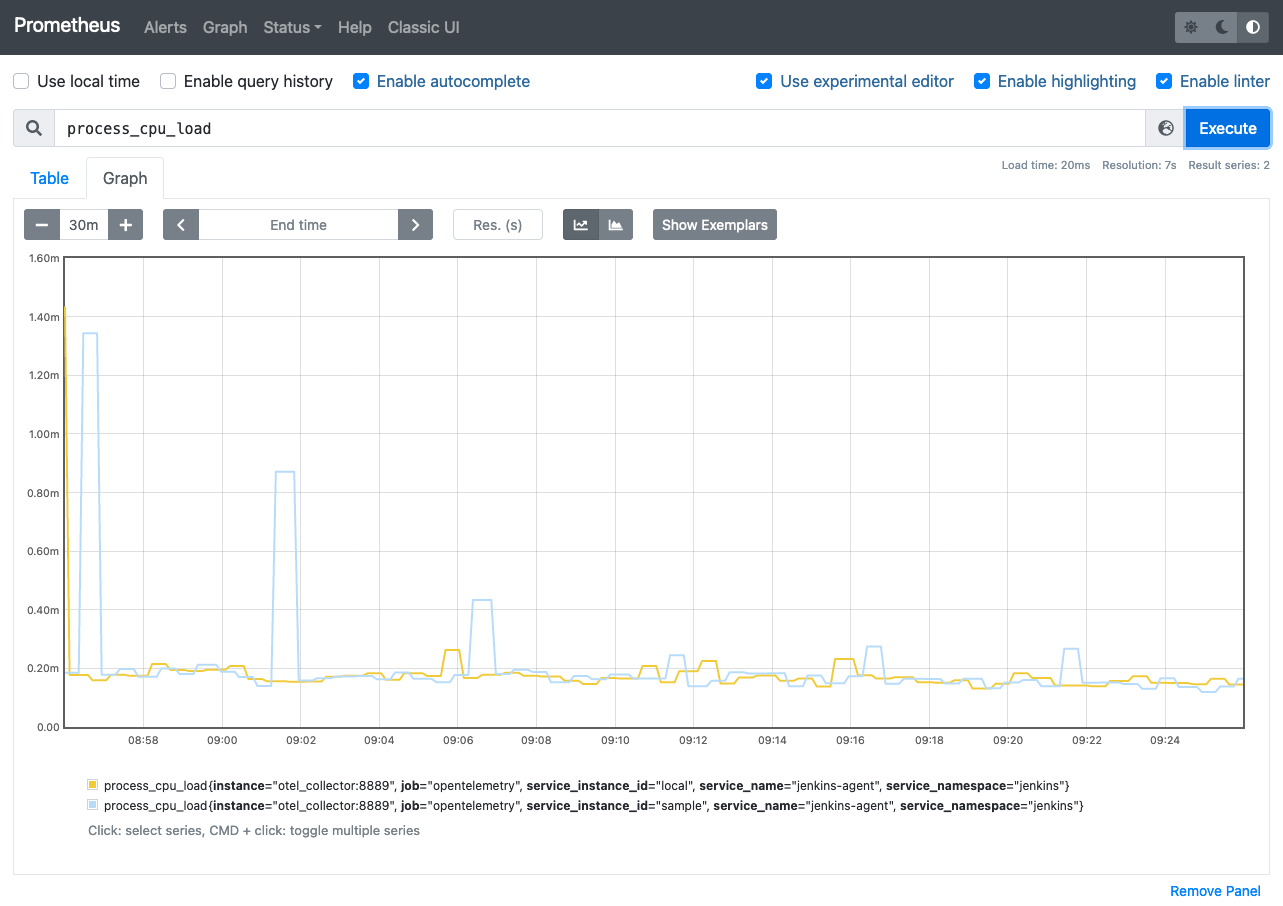
Metrics
We currently support the following metrics and planning to support more.
metrics |
unit |
label |
key |
description |
system.cpu.load |
1 |
System CPU load. See |
||
system.cpu.load.average.1m |
System CPU load average 1 minute See |
|||
system.memory.usage |
bytes |
state |
|
see |
system.memory.utilization |
1 |
System memory utilization,
see |
||
system.paging.usage |
bytes |
state |
|
see |
system.paging.utilization |
1 |
see |
||
process.cpu.load |
% |
Process CPU load. See |
||
process.cpu.time |
ns |
Process CPU time. See |
||
runtime.jvm.memory.area |
bytes |
type |
|
see MemoryUsage |
area |
|
|||
runtime.jvm.memory.pool |
bytes |
type |
|
see MemoryUsage |
pool |
|
|||
runtime.jvm.gc.time |
ms |
gc |
|
|
runtime.jvm.gc.count |
1 |
gc |
|
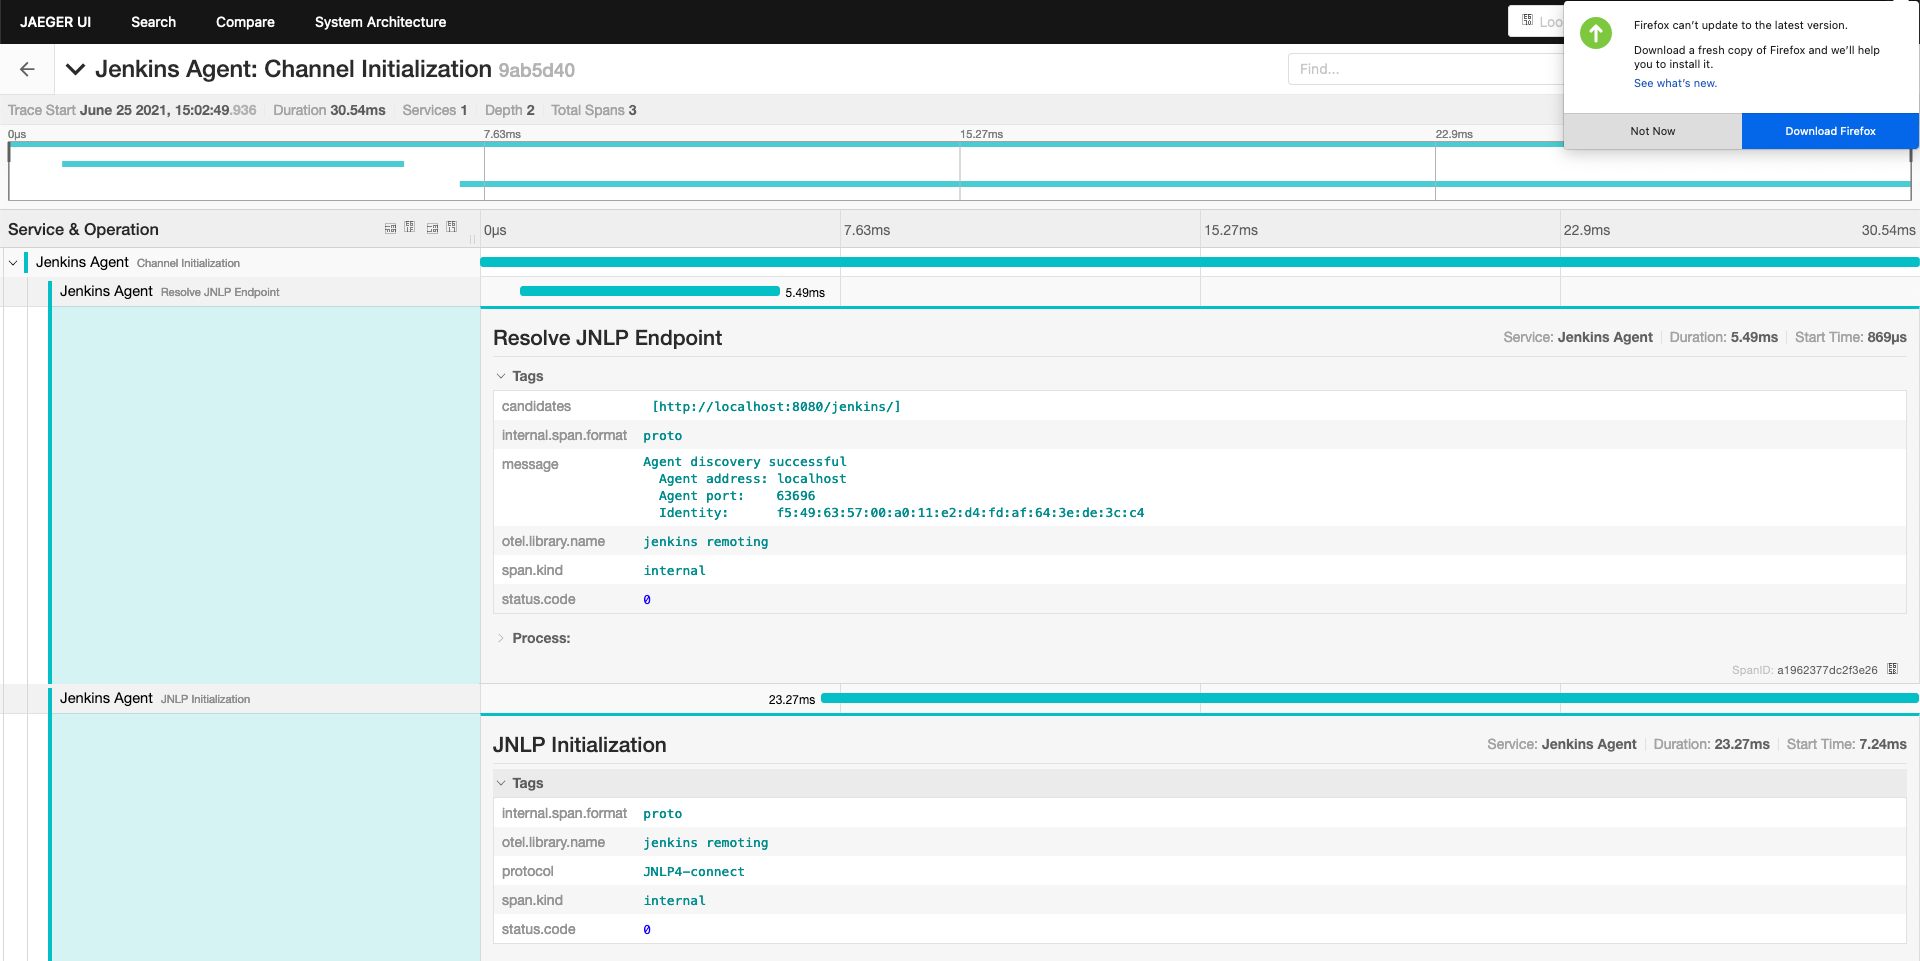
Traces
We tried several approaches to instrument remoting module, but good approach is not established yet.
Here is a draft documentation of the spans to collect. Google Doc
About the author