Reading CI Failures Across Pipelines, Not One Build at a Time
Jenkins is good at explaining a single build. The console, the stage view and the test report all answer "what happened in build #247".
On a busy controller, most CI questions are not about a single build:
-
Five pipelines are red. Is that five problems or one?
-
Which of them broke this morning, and which have been red since last week?
-
Are builds getting slower?
-
Is somebody still holding the staging environment?
Answering those from the job list means opening every job. I got tired of finding out that a pipeline had been red for two days without anyone noticing. This post goes through the signals that answer those questions, how to compute each one from data Jenkins already has, and where they fall short. The examples come from Holistic, a dashboard plugin that implements them.
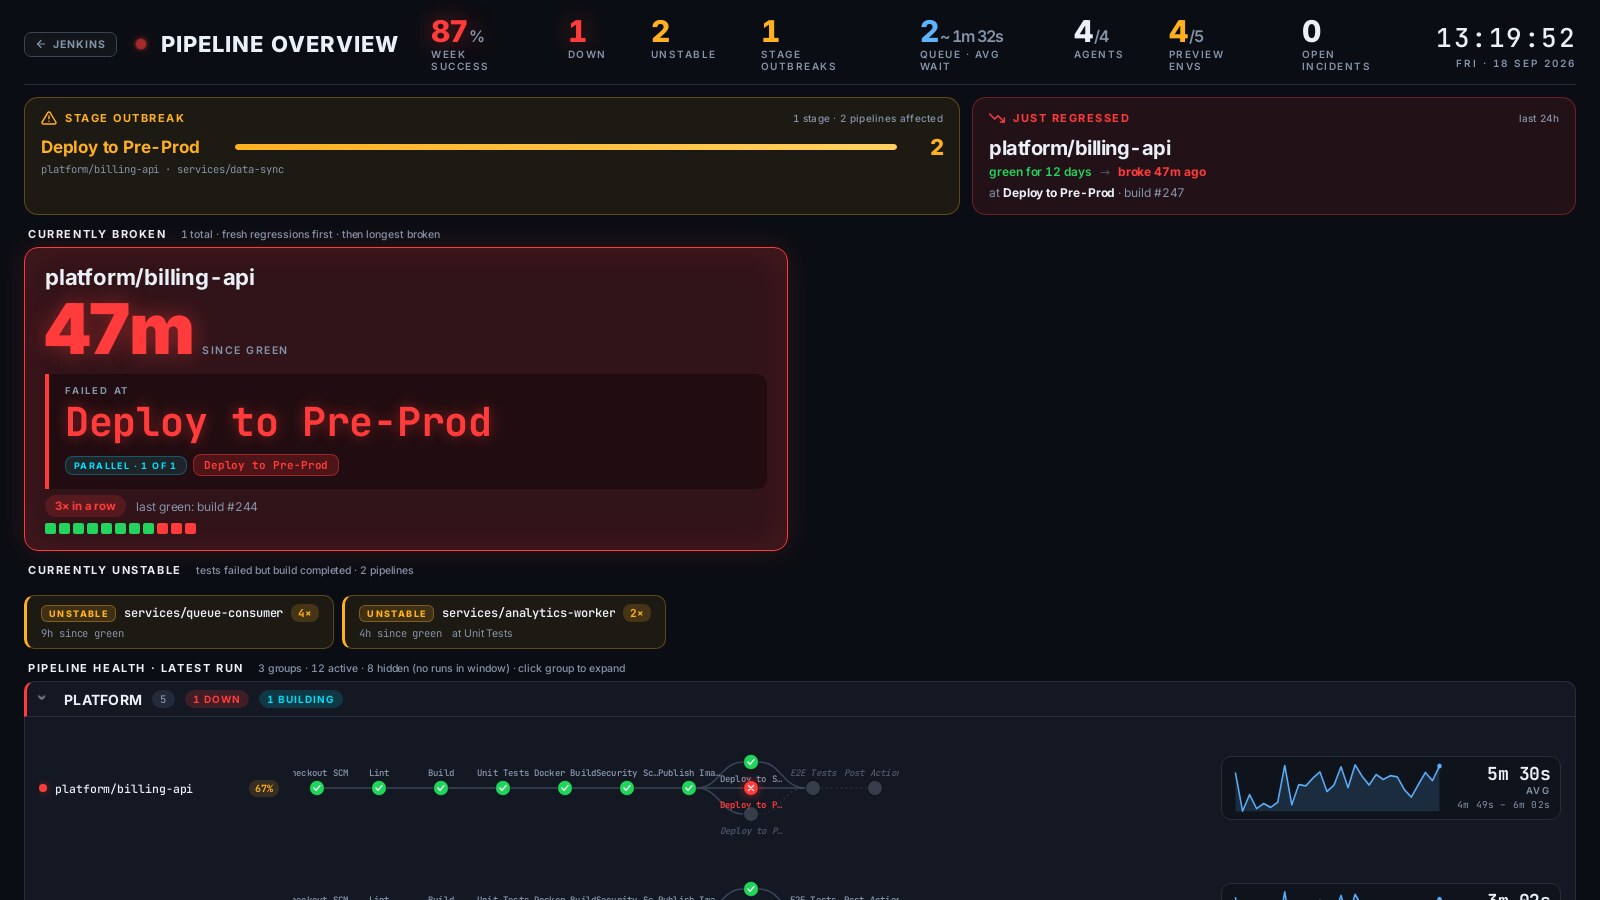
The full-screen view with mock data. The same page is available as a live demo.
Group failures by the stage that broke
If five pipelines fail at Deploy within the same hour, you probably have one problem: a shared library change, an expired credential, a deploy target that is down. Looking at the five failures one by one hides that.
The grouping is cheap. For every pipeline whose latest build failed (a pipeline with a build still running is left out until it finishes), take the name of the failed stage and group on it. A stage name shared by two or more broken pipelines is an outbreak. This works because teams reuse stage names across pipelines, often through a shared library.

It depends on consistent naming. Deploy and deploy-staging do not cluster. It also tells you where things broke, not why.
Separate fresh regressions from old breakage
"Currently red" mixes two different situations. One pipeline broke 40 minutes ago after 12 days of green builds. Another has been red for three weeks, and everyone already knows about it. The first one needs attention now: something just changed, and whoever changed it is probably still around.
Holistic calls a pipeline "just regressed" when its green streak lasted at least 6 hours and the break happened in the last 24 hours. Both values come from build history. The break is the first failing build after the last success. The streak start is the oldest build of the uninterrupted run of successful builds before it.
Measure the streak from its first green build, not the last one. On a pipeline that builds on every commit, the last green build is often minutes before the break, so measuring from it makes every busy pipeline look like it was barely green.
Fresh regressions are listed first. The remaining broken pipelines follow, longest broken first.
Do not trust green on a skipped stage
When a declarative stage is skipped, because of a when condition or an earlier failure, the flow graph still reports it as successful. It even has a start time and a short duration. The run data from Pipeline: REST API reports the same stage as NOT_EXECUTED.
If you build a stage view from the flow graph alone, skipped stages render green, and a pipeline that never reached Deploy looks like it deployed.
Holistic uses the REST API run data to decide whether a stage ran and how it ended. The flow graph is only allowed to make a stage look worse, for example when a test publisher marks the build unstable, and to show stages that are still running. It never turns a skipped stage green.
Keep unstable apart from failed
"Tests failed but the build completed" is a different problem from "the build itself broke", and it usually goes to different people. Holistic lists unstable pipelines in their own section, with how many of their recent builds were unstable.
Watch the trend of successful builds
Builds rarely get slower in one step. A few percent per week goes unnoticed until someone asks why the pipeline takes 20 minutes now.
Holistic keeps the durations of the last 30 successful builds of each pipeline. Failed and aborted builds are left out, because they end early or hang and would distort the trend. It compares the average of the newer half with the older half, and marks the pipeline amber when it got more than 15% slower, green when it got more than 10% faster.
Stuck locks and queue depth
With Lockable Resources, a lock that stays held is usually a hung build or a person who forgot to release it. Holistic lists locks longest held first, amber after 15 minutes, red after 30. This panel only appears when the Lockable Resources plugin is installed.
Queue depth is sampled over time. A queue that stays full means you need more agents. A short spike means you had a burst.

On the wall or inside Jenkins
Holistic is a view. Embedded in Jenkins, it follows the Jenkins theme. It also has a full-screen mode for an office TV: large type, no Jenkins chrome, readable from across the room.
The simplest setup discovers pipelines on its own. Groups come from the folder name, or from the first dash-separated part of the job name, and PR-* branches are skipped:
jenkins:
  views:
    - holistic:
        name: "Pipeline Overview"
        autoDiscover: true
You can also list the pipelines of each group explicitly, and add tiles fed by any HTTP endpoint that returns a JSON object or array, for example the number of preview environments in Argo CD. The README has the full configuration.
Try it
-
Live demo with mock data: jenkinsci.github.io/holistic-plugin
-
Install: Manage Jenkins > Plugins > Available plugins, search for Holistic
-
Source: jenkinsci/holistic-plugin
The plugin is young, and the thresholds above come from one team’s CI. If they do not fit yours, or something is missing, tell me in GitHub Discussions.