Plugin of the Month – April 2026: Pipeline Graph View

Welcome back to the Plugin of the Month series, where we highlight useful and impactful plugins from the Jenkins ecosystem.
For April 2026, we’re featuring the Pipeline Graph View Plugin.
A Modern Pipeline Visualization
The Pipeline Graph View plugin provides a clean and modern visualization of Jenkins pipelines directly in the standard Jenkins UI.
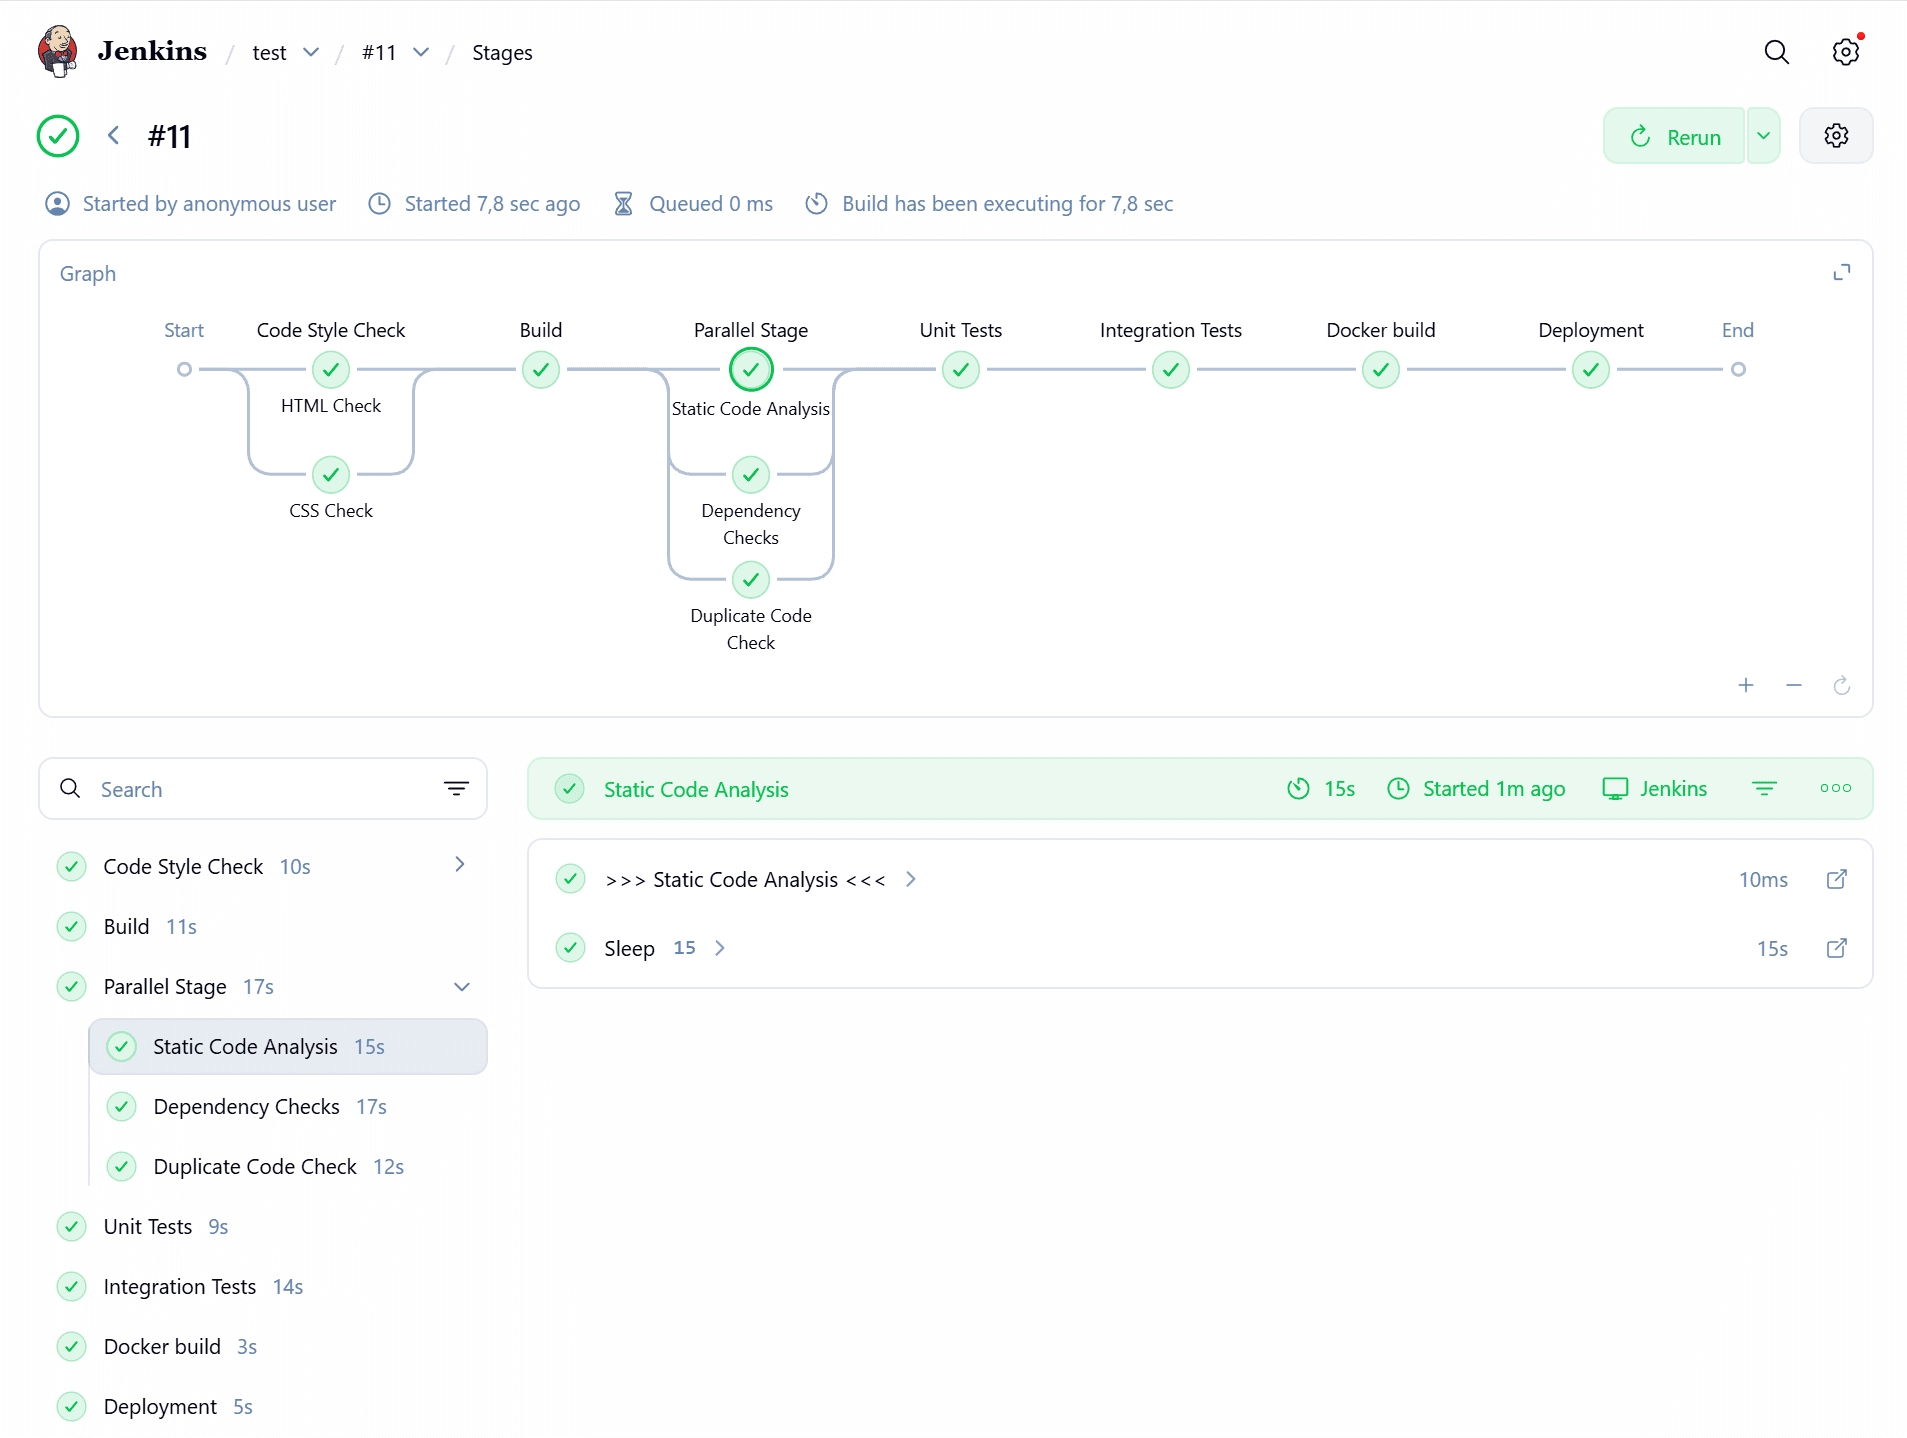
It is designed to give users a clear overview of pipeline stages and their execution flow, without requiring a separate interface or additional UI layer.
If you’ve used Blue Ocean in the past, this might feel familiar, but with an important difference.
The Successor to Blue Ocean
As many in the Jenkins community are aware, Blue Ocean has been deprecated.
While it introduced a modern and intuitive way to visualize pipelines, maintaining a separate UI stack proved challenging in the long run.
The Pipeline Graph View plugin takes a different approach:
-
It integrates directly into the existing Jenkins UI
-
It focuses specifically on pipeline visualization
-
It avoids the overhead of maintaining a full alternative interface
This makes it a natural and lightweight successor for users looking for a modern pipeline view without switching contexts.
Why It Matters
Understanding pipeline execution is essential for debugging, optimization, and daily development workflows.
The Pipeline Graph View plugin helps by:
-
Providing a clear visual representation of pipeline stages
-
Making it easier to identify failures and bottlenecks
-
Improving the overall usability of Jenkins pipelines
-
Keeping everything within the familiar Jenkins interface
It brings back the visual clarity many users appreciated in Blue Ocean, while aligning with the direction of Jenkins.
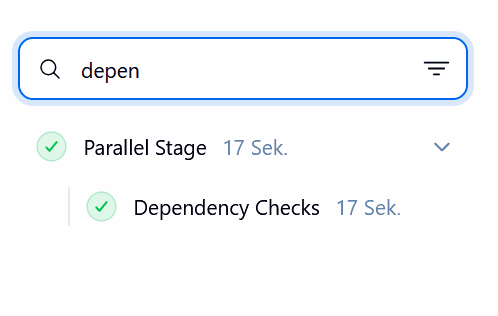
If you work in a rather complex pipeline environment, this plugin can help you to faster find the stage that is interesting for you and to understand the flow of your pipeline. You can simply use the search function to find the stage you are looking for and then click on it to jump to the stage details.
Seamless Integration
One of the biggest advantages of this plugin is its seamless integration.
There’s no need to:
-
Switch to a different UI
-
Maintain a separate plugin ecosystem
-
Relearn how Jenkins works
You simply get an improved pipeline visualization experience where you already work.
Looking Ahead
The Pipeline Graph View plugin is a great example of how the Jenkins community continues to evolve the user experience while staying true to the platform’s strengths.
If you’re still relying on older visualization tools or missing features from Blue Ocean, this plugin is definitely worth exploring.
Stay tuned for next month’s Plugin of the Month, and feel free to suggest plugins you’d like to see featured!
About the author
I started contributing regularly in 2019, with a focus on improving quality. I’m also keeping up with some older plugins that are still really popular, like the Thin Backup Plugin and the Job Configuration History Plugin. The community helped me to bring these back up to standard and I learned a lot along the way. Furthermore, I use these lessons to make regular improvements to the developer documentation.
In my day job, I’m a solution architect in a central team that provides Jenkins and DevOps consulting within a big automotive and industrial company.
