Tuning Jenkins GC For Responsiveness and Stability with Large Instances
|
This is a cross post by Sam Van Oort, Software Engineer at CloudBees and contributor to the Jenkins project. |
Today I’m going to show you how easy it is to tune Jenkins Java settings to make your controllers more responsive and stable, especially with large heap sizes.
The Magic Settings:
-
Basics:
-server -XX:+AlwaysPreTouch -
GC Logging:
-Xloggc:$JENKINS_HOME/gc-%t.log -XX:NumberOfGCLogFiles=5 -XX:+UseGCLogFileRotation -XX:GCLogFileSize=20m -XX:+PrintGC -XX:+PrintGCDateStamps -XX:+PrintGCDetails -XX:+PrintHeapAtGC -XX:+PrintGCCause -XX:+PrintTenuringDistribution -XX:+PrintReferenceGC -XX:+PrintAdaptiveSizePolicy -
G1 GC settings:
-XX:+UseG1GC -XX:+ExplicitGCInvokesConcurrent -XX:+ParallelRefProcEnabled -XX:+UseStringDeduplication -XX:+UnlockExperimentalVMOptions -XX:G1NewSizePercent=20 -XX:+UnlockDiagnosticVMOptions -XX:G1SummarizeRSetStatsPeriod=1 -
Heap settings: set your minimum heap size (
-Xms) to at least 1/2 of your maximum size (-Xmx).
Now, let’s look at where those came from! We’re going to focus on garbage collection (GC) here and dig fast and deep to strike for gold; if you’re not familiar with GC fundamentals take a look at this source.
Because performance tuning is data driven, I’m going to use real-world data selected three very large Jenkins instances that I help support.
What we’re not going to do: Jenkins basics, or play with max heap. See the section "what should I do before tuning." This is for cases where we really do need a big heap and can’t easily split our Jenkins controllers into smaller ones.
The Problem: Hangups
Symptom: Users report that the Jenkins instance periodically hangs, taking several seconds to handle normally fast requests. We may even see lockups or timeouts from systems communicating with the Jenkins controller (build agents, etc). In long periods of heavy load, users may report Jenkins running slowly. Application monitoring shows that during lockups all or most of the CPU cores are fully loaded, but there’s not enough activity to justify it. Process and JStack dumps will reveal that the most active Java threads are doing garbage collection.
With Instance A, they had this problem. Their Jenkins Java arguments are very close to the default, aside from sizing the heap:
-
24 GB max heap, 4 GB initial, default GC settings (ParallelGC)
-
A few flags set (some coming in as defaults):
-XX:-BytecodeVerificationLocal -XX:-BytecodeVerificationRemote -XX:+ReduceSignalUsage -XX:+UseCompressedClassPointers -XX:+UseCompressedOops -XX:-UseLargePagesIndividualAllocation
After enabling garbage collection (GC) logging we see the following rough stats:
 .
.
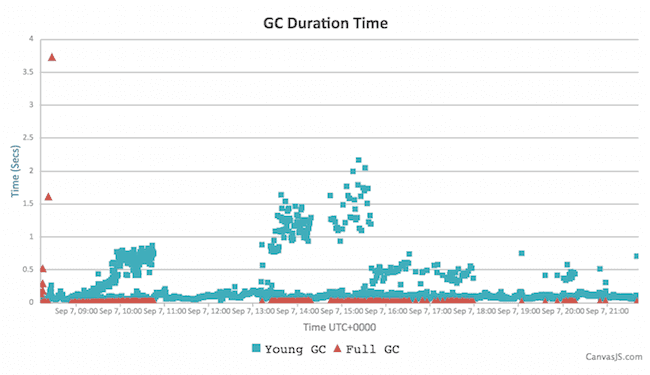
Diving deeper, we get this chart of GC pause durations:
Key stats:
-
Throughput: 99.64% (percent of time spent executing application code, not doing garbage collection)
-
Average GC time: 348 ms (ugh!)
-
GC cycles over 2 seconds: 36 (2.7%)
-
Minor/Full GC average time: 263 ms / 2.803 sec
-
Object creation & promotion rate: 42.4 MB/s & 1.99 MB/s
Explanations:
As you can see, young GC cycles very quickly clear away freshly-created garbage, but the deeper old-gen GC cycles run very slowly: 2-4 seconds. This is where our problems happen. The default Java garbage collection algorithm (ParallelGC) pauses everything when it has to collect garbage (often called a "stop the world pause"). During that period, Jenkins is fully halted: normally (with small heaps) these pauses are too brief to be an issue. With heaps of 4 GB or larger, the time required becomes long enough to be a problem: several seconds over short windows, and over a longer interval you occasionally see much longer pauses (tens of seconds, or minutes.)
This is where the user-visible hangs and lock-ups happen. It also adds significant latency to those build/deploy tasks. In periods of heavy load, the system was even experiencing hangs of 30+ seconds for a single full GC cycle. This was long enough to trigger network timeouts (or internal Jenkins thread timeouts) and cause even larger problems.
Fortunately there’s a solution: the concurrent low-pause garbage collection algorithms, Concurrent Mark Sweep (CMS) and Garbage First (G1). These attempt to do much of the garbage collection concurrently with application threads, resulting in much shorter pauses (at a slight cost in extra CPU use). We’re going to focus on G1, because it is slated to become the default in Java 9 and is the official recommendation for large heap sizes.
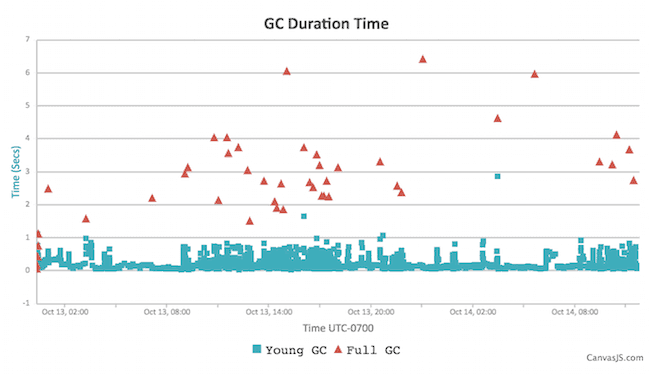
Let’s see what happens when someone uses G1 on a similarly-sized Jenkins controller with Instance B (17 GB heap):
Their settings:
-
16 GB max heap, 0.5 GB initial size
-
Java flags (mostly defaults, except for G1):
-XX:+UseG1GC -XX:+UseCompressedClassPointers -XX:+UseCompressedOops
And the GC log analysis:
Key stats:
-
Throughput: 98.76% (not great, but still only slowing things down a bit)
-
Average GC time: 128 ms
-
GC cycles over 2 seconds: 11, 0.27%
-
Minor/Full GC average time: 122 ms / 1 sec 232 ms
-
Object creation & promotion rate: 132.53 MB/s & 522 KB/s
Okay, much better: some improvement may be expected from a 30% smaller heap, but not as much as we’ve seen. Most of the GC pauses are well under 2 seconds, but we have 11 outliers - long Full GC pauses of 2-12 seconds. Those are troubling; we’ll take a deeper dive into their causes in a second. First, let’s look at the big picture and at how Jenkins behaves with G1 GC for a second instance.
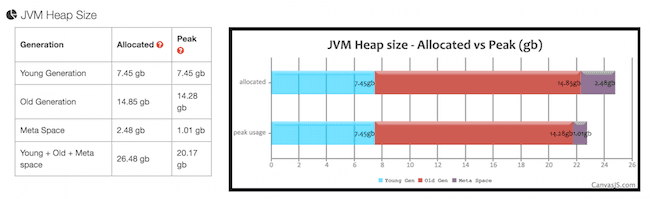
G1 Garbage Collection with Instance C (24 GB heap):
Their settings:
-
24 GB max heap, 24 GB initial heap, 2 GB max metaspace
-
Some custom flags: `-XX:+UseG1GC -XX:+AlwaysPreTouch -XX:+UseStringDeduplication -XX:+UseCompressedClassPointers -XX:+UseCompressedOops `
Clearly they’ve done some garbage collection tuning and optimization. The AlwaysPreTouch pre-zeros allocated heap pages, rather than waiting until they’re first used. This is suggested especially for large heap sizes, because it trades slightly slower startup times for improved runtime performance. Note also that they pre-allocated the whole heap. This is a common optimization.
They also enabled StringDeduplication, a G1 option introduced in Java 8 Update
20 that transparently replaces identical character arrays with pointers to the
original, reducing memory use (and improving cache performance). Think of it
like String.intern() but it silently happens during garbage collection. This
is a concurrent operation added on to normal GC cycles, so it doesn’t pause the
application. We’ll look at its impacts later.
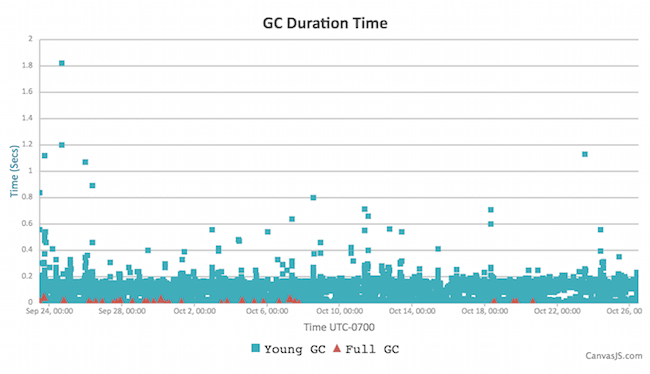
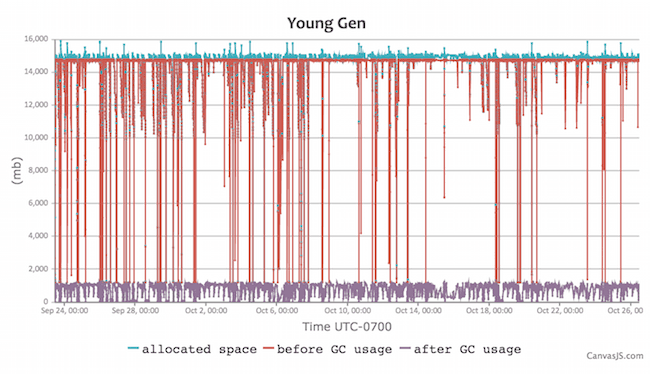
Looking at the basics:
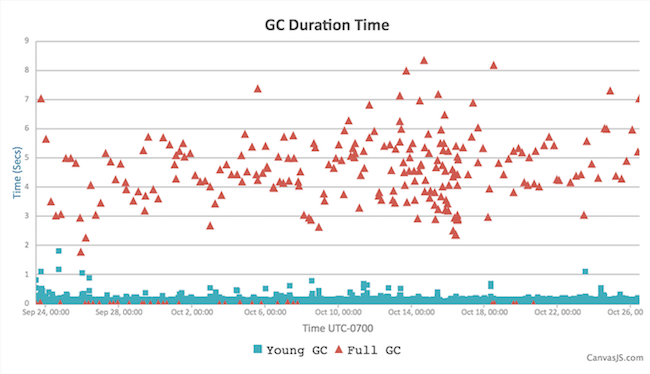
Similar picture to Instance B, but it’s hidden by the sheer number of points (this is a longer period here, 1 month). Those same occasional Full GC outliers are present!
Key stats:
-
Throughput: 99.93%
-
Average GC time: 127 ms
-
GC cycles over 2 seconds: 235 (1.56%)
-
Minor/Full GC average time: 56 ms / 3.97 sec
-
Object creation & promotion rate: 34.06 MB/s & 286 kb/s
Overall fairly similar to Instance B: ~100 ms GC cycles, all the minor GC cycles are very fast. Object promotion rates sound similar.
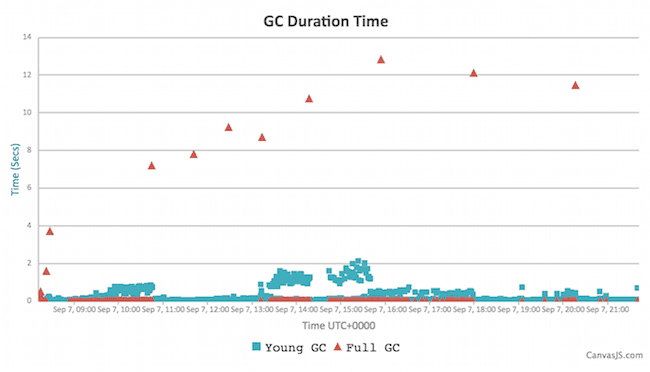
Remember those random long pauses?
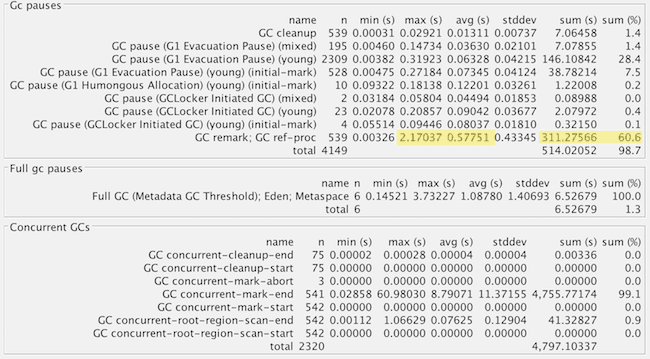
Let’s find out what caused them and how to get rid of them. Instance B had 11 super-long pause outliers. Let’s get some more detail, by opening GC Logs in GCViewer. This tool gives a tremendous amount of information. Too much, in fact — I prefer to use GCEasy.io except where needed. Since GC logs do not contain compromising information (unlike heap dumps or some stack traces), web apps are a great tool for analysis.
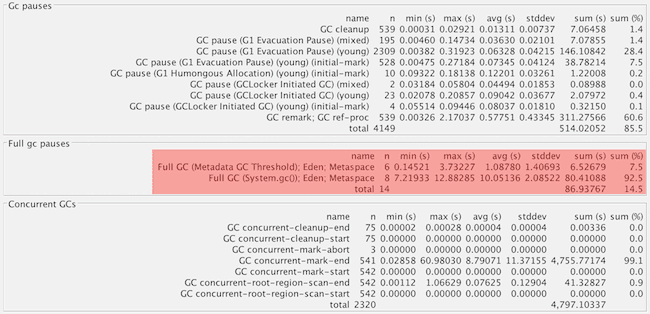
What we care about are at the Full GC times in the middle (highlighted). See how much longer they are vs. the young and concurrent GC cycles up top (2 seconds or less)?
Now, I lied a bit earlier - sorry! For concurrent garbage collectors, there are actually 3 modes: young GC, concurrent GC, and full GC. Concurrent GC replaces the Full GC mode in Parallel GC with a faster concurrent operation that runs in parallel with the application. But in a few cases, we are forced to fall back to a non-concurrent Full GC operation, which will use the serial (single-threaded) garbage collector. That means that even if we have 30+ CPU cores, only one is working. This is what is happening here, and on a large-heap, multicore system it is S L O W. How slow? 280 MB/s vs. 12487 MB/s for Instance B (for instance C, the difference is also about 50:1).
What triggers a full GC instead of concurrent:
-
Explicit calls to
System.gc()(most common culprit, often tricky to trace down) -
Metadata GC Threshold: Metaspace (used for Class data mostly) has hit the defined size to force garbage collection or increase it. Documentation is terrible for this, Stack Overflow will be your friend.
-
Concurrent mode failure: concurrent GC can’t complete fast enough to keep up with objects the application is creating (there are JVM arguments to trigger concurrent GC earlier)
How do we fix this?
For explicit GC:
-
-XX:+DisableExplicitGCwill turn off Full GC triggered bySystem.gc(). Often set in production, but the below option is safer. -
We can trigger a concurrent GC in place of a full one with
-XX:+ExplicitGCInvokesConcurrent- this will take the explicit call as a hint to do deeper cleanup, but with less performance cost.
Gotcha for people who’ve used CMS: if you have used CMS in the past, you
may have used the option -XX:+ExplicitGCInvokesConcurrentAndUnloadsClasses — which does what it says. This option will silently fail in G1, meaning you
still see the very long pauses from Full GC cycles as if it wasn’t set (no
warning is generated). I have logged a JVM bug for this issue.
For the Metadata GC threshold:
-
Increase your initial metaspace to the final amount to avoid resizing. For example:
-XX:MetaspaceSize=500M
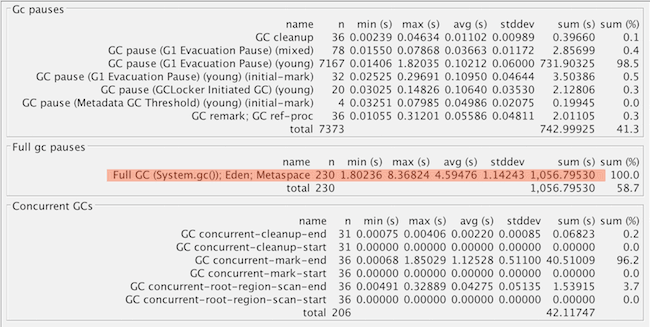
Instance C also suffered the same problem with explicit GC calls, with almost
all our outliers accounted for (230 out of 235) by slow, nonconcurrent Full GC
cycles (all from explicit System.gc() calls, since they tuned metaspace):
Here’s what GC pause durations look like if we remove the log entries for the
explicit System.gc() calls, assuming that they’ll blend in with the other
concurrent GC pauses (not 100% accurate, but a good approximation):
Instance B:
The few long Full GC cycles at the start are from metaspace expansion — they can be removed by increasing initial Metaspace size, as noted above. The spikes? That’s when we’re about to resize the Java heap, and memory pressure is high. You can avoid this by setting the minimum/initial heap to at least half of the maximum, to limit resizing.
Stats:
-
Throughput: 98.93%
-
Average GC time: 111 ms
-
GC cycles over 2 seconds: 3
-
Minor & Full or concurrent GC average time: 122 ms / 25 ms (yes, faster than minor!)
-
Object creation & promotion rate: 132.07 MB/s & 522 kB/s
Instance C:
Stats:
-
Throughput: 99.97%
-
Average GC time: 56 ms
-
GC cycles over 2 seconds: 0 (!!!)
-
Minor & Full or concurrent GC average time: 56 ms & 10 ms (yes, faster than minor!)
-
Object creation & promotion rate: 33.31 MB/s & 286 kB/s
-
Side point: GCViewer is claiming GC performance of 128 GB/s (not unreasonable, we clear ~10 GB of young generation in under 100 ms usually)
Okay, so we’ve tamed the long worst-case pauses!
But What About Those Long Minor GC Pauses We Saw?
Okay, now we’re in the home stretch! We’ve tamed the old-generation GC pauses with concurrent collection, but what about those longer young-generation pauses? Lets look at stats for the different phases and causes again in GCViewer.
Highlighted in yellow we see the culprit: the remark phase of G1 garbage collection. This stop-the-world phase ensures we’ve identified all live objects, and process references ( more info).
Let’s look at a sample execution to get more info:
2016-09-07T15:28:33.104+0000: 26230.652: [GC remark 26230.652: [GC ref-proc, 1.7204585 secs], 1.7440552 secs]

 [Times: user=1.78 sys=0.03, real=1.75 secs]
This turns out to be typical for the GC log: the longest pauses are spent in reference processing. This is not surprising because Jenkins internally uses references heavily for caching, especially weak references, and the default reference processing algorithm is single-threaded. Note that user (CPU) time matches real time, and it would be higher if we were using multiple cores.
So, we add the GC flag -XX:+ParallelRefProcEnabled which enables us to use the multiple cores more effectively.
Tuning young-generation GC further based on Instance C:
Back to GCViewer we go, to see what’s time consuming with the GC for Instance C.
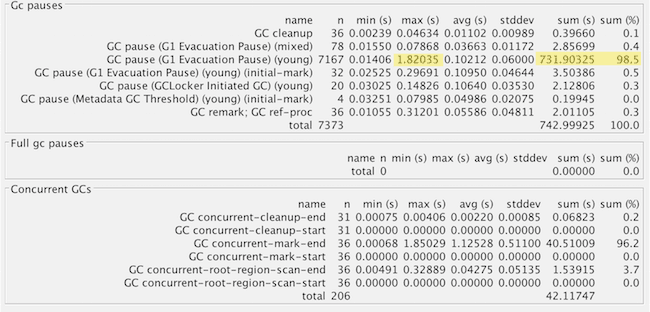
That’s good, because most of the time is just sweeping out the trash (evacuation pause). But the 1.8 second pause looks odd. Let’s look at the raw GC log for the longest pause:
2016-09-24T16:31:27.738-0700: 106414.347: [GC pause (G1 Evacuation Pause) (young), 1.8203527 secs]
[Parallel Time: 1796.4 ms, GC Workers: 8]
 [GC Worker Start (ms): Min: 106414348.2, Avg: 106414348.3, Max: 106414348.6, Diff: 0.4]
[Ext Root Scanning (ms): Min: 0.3, Avg: 1.7, Max: 5.7, Diff: 5.4, Sum: 14.0]
  [Update RS (ms): Min: 0.0, Avg: 7.0, Max: 19.6, Diff: 19.6, Sum: 55.9]
    [Processed Buffers: Min: 0, Avg: 45.1, Max: 146, Diff: 146, Sum: 361]
 [Scan RS (ms): Min: 0.2, Avg: 0.4, Max: 0.7, Diff: 0.6, Sum: 3.5]
 [Code Root Scanning (ms): Min: 0.0, Avg: 0.0, Max: 0.1, Diff: 0.1, Sum: 0.2]
 [Object Copy (ms): Min: 1767.1, Avg: 1784.4, Max: 1792.6, Diff: 25.5, Sum: 14275.2]
 [Termination (ms): Min: 0.3, Avg: 2.4, Max: 3.5, Diff: 3.2, Sum: 19.3]
    [Termination Attempts: Min: 11, Avg: 142.5, Max: 294, Diff: 283, Sum: 1140]
 [GC Worker Other (ms): Min: 0.0, Avg: 0.1, Max: 0.4, Diff: 0.3, Sum: 0.8]
 [GC Worker Total (ms): Min: 1795.9, Avg: 1796.1, Max: 1796.2, Diff: 0.3, Sum: 14368.9]
[GC Worker End (ms): Min: 106416144.4, Avg: 106416144.5, Max: 106416144.5, Diff: 0.1]…oh, well dang. Almost the entire time (1.792 s out of 1.820) is walking through the live objects and copying them. And wait, what about this line, showing the summary statistics:
Eden: 13.0G(13.0G)->0.0B(288.0M) Survivors: 1000.0M->936.0M Heap: 20.6G(24.0G)->7965.2M(24.0G)]Good grief, we flushed out 13 GB (!!!) of freshly-allocated garbage in one swoop and compacted the leftovers! No wonder it was so slow. I wonder how we accumulated so much…
Oh, right… we set up for 24 GB of heap initially, and each minor GC clears most of the young generation. Okay, so we’ve set aside tons of space for trash to collect, which means longer but less frequent GC periods. This also gets the best performance from Jenkins memory caches which are using WeakReferences (survives until collected by GC) and SoftReferences (more long-lived). Those caches boost performance a lot.
We could take actions to prevent those rare longer pauses. The best ways are to
limit total heap size or reduce the value of -XX:MaxGCPauseMillis=200 from
its default (200). A more advanced way (if those don’t help enough) is to
explicitly set the maximum size of the young generation smaller (say
-XX:G1MaxNewSizePercent=45 instead of the default of 60). We could also
throw more CPUs at the problem.
But if we look up, most pauses are around 100 ms (200 ms is the default value for MaxGCPauseMillis). For Jenkins on this hardware, this appears to work just fine and a rare longer pause is OK as long as they don’t get too big. Also remember, if this happens often, G1 GC will try to autotune for lower pauses and more predictable performance.
A Few Final Settings
We mentioned StringDeduplication was on with Instance C, what is the impact? This only triggers on Strings that have survived a few generations (most of our garbage does not), has limits on the CPU time it can use, and replaces duplicate references to their immutable backing character arrays. For more info, look here. So, we should be trading a little CPU time for improved memory efficiently (similarly to string interning).
At the beginning, this has a huge impact:
[GC concurrent-string-deduplication, 375.3K->222.5K(152.8K), avg 63.0%, 0.0     024966 secs]
[GC concurrent-string-deduplication, 4178.8K->965.5K(3213.2K), avg 65.3%, 0     .0272168 secs]
[GC concurrent-string-deduplication, 36.1M->9702.6K(26.6M), avg 70.3%, 0.09     65196 secs]
[GC concurrent-string-deduplication, 4895.2K->394.9K(4500.3K), avg 71.9%, 0     .0114704 secs]
This peaks at an average of about ~90%:
After running for a month, less of an impact - many of the strings that can be deduplicated already are:
[GC concurrent-string-deduplication, 138.7K->39.3K(99.4K), avg 68.2%, 0.0007080 secs]
[GC concurrent-string-deduplication, 27.3M->21.5M(5945.1K), avg 68.1%, 0.0554714 secs]
[GC concurrent-string-deduplication, 304.0K->48.5K(255.5K), avg 68.1%, 0.0021169 secs]
[GC concurrent-string-deduplication, 748.9K->407.3K(341.7K), avg 68.1%, 0.0026401 secs]
[GC concurrent-string-deduplication, 3756.7K->663.1K(3093.6K), avg 68.1%, 0.0270676 secs]
[GC concurrent-string-deduplication, 974.3K->17.0K(957.3K), avg 68.1%, 0.0121952 secs]
However it’s cheap to use: in average, each dedup cycle takes 8.8 ms and removes 2.4 kB of duplicates. The median takes 1.33 ms and removes 17.66 kB from the old generation. A small change per cycle, but in aggregate it adds up quickly — in periods of heavy load, this can save hundreds of megabytes of data. But that’s still small, relative to multi-GB heaps.
Conclusion: turn string deduplication on string deduplication is fairly cheap to use, and reduces the steady-state memory needed for Jenkins. That frees up more room for the young generation, and should overall reduce GC time by removing duplicate objects. I think it’s worth turning on.
Soft reference flushing: Jenkins uses soft references for caching build
records and in pipeline FlowNodes. The only guarantee for these is that they
will be removed instead of causing an OutOfMemoryError… however Java
applications can slow to a crawl from memory pressure long before that happens.
There’s an option that provides a hint to the JVM based on time & free memory,
controlled by -XX:SoftRefLRUPolicyMSPerMB (default 1000). The SoftReferences
become eligible for garbage collection after this many milliseconds have
elapsed since last touch… per MB of unused heap (vs the maximum). The
referenced objects don’t count towards that target. So, with 10 GB of heap
free and the default 1000 ms setting, soft references stick around for ~2.8
hours (!).
If the system is continuously allocating more soft references, it may trigger heavy GC activity, rather than clearing out soft references. See the open bug JDK-6912889 for more details.
If Jenkins consumes excessive old generation memory, it may help to make soft references easier to flush by reducing -XX:SoftRefLRUPolicyMSPerMB from its default (1000) to something smaller (say 10-200). The catch is that SoftReferences are often used for objects that are relatively expensive to load, such lazy-loaded build records and pipeline FlowNode data.
Caveats
G1 vs. CMS:
G1 was available on later releases of JRE 7, but unstable and slow. If you use it you absolutely must be using JRE 8, and the later the release the better (it’s gotten a lot of patches). Googling around will show horrible G1 vs CMS benchmarks from around 2014: these are probably best ignored, since the G1 implementation was still immature then. There’s probably a niche for CMS use still, especially on midsized heaps (1-3 GB) or where settings are already tuned. With appropriate tuning it can still perform generally well for Jenkins (which mostly generates short-lived garbage), but CMS eventually suffer from heap fragmentation and need a slow, non-concurrent Full GC to clear this. It also needs considerably more tuning than G1.
General GC tuning caveats:
No single setting is perfect for everybody. We avoid tweaking settings that we don’t have strong evidence for here, but there are of course many additional settings to tweak. One shouldn’t change them without evidence though, because it can cause unexpected side effects. The GC logs we enabled earlier will collect this evidence. The only setting that jumps out as a likely candidate for further tuning is G1 region size (too small and there are many humungous object allocations, which hurt performance). Running on smaller systems, I’ve seen evidence that regions shouldn’t be smaller than 4 MB because there are 1-2 MB objects allocated somewhat regularly — but it’s not enough to make solid guidance without more data.
What Should I Do Before Tuning Jenkins GC:
If you’ve seen Stephen Connolly’s excellent Jenkins World talk, you know that most Jenkins instances can and should get by with 4 GB or less of allocated heap, even up to very large sizes. You will want to turn on GC logging (suggested above) and look at stats over a few weeks (remember GCeasy.io). If you’re not seeing periodic longer pause times, you’re probably okay.
For this post we assume we’ve already done the basic performance work for Jenkins:
-
Jenkins is running on fast, SSD-backed storage.
-
We’ve set up build rotation for your Jobs, to delete old builds so they don’t pile up.
-
The weather column is already disabled for folders.
-
All builds/deploys are running on build agents not on the controller. If the controller has executors allocated, they are exclusively used for backup tasks.
-
We’ve verified that Jenkins really does need the large heap size and can’t easily be split into separate controllers.
If not, we need to do that FIRST before looking at GC tuning, because those will have larger impacts.
Conclusions
We’ve gone from:
-
Average 350 ms pauses (bad user experience) including less frequent 2+ second generation pauses
-
To an average pause of ~50 ms, with almost all under 250 ms
-
Reduced total memory footprint from String deduplication
How:
-
Use Garbage First (G1) garbage collection, which performs generally very well for Jenkins. Usually there’s enough spare CPU time to enable concurrent running.
-
Ensure explicit
System.gc()and metaspace resizing do not trigger a Full GC because this can trigger a very long pause -
Turn on parallel reference processing for Jenkins to use all CPU cores fully.
-
Use String deduplication, which generates a tidy win for Jenkins
-
Enable GC logging, which can then be used for the next level of tuning and diagnostics, if needed.
There’s still a little unpredictability, but using appropriate settings gives a much more stable, responsive CI/CD server… even up to 20 GB heap sizes!